Just saying, but during this past week of the Democratic nominating convention, I had one blog article shoot up the charts on views:
RIP Republican Party 1856-2015.
edit: this is nothing like the weird Russia-driven traffic that I and others have been getting the past few days, where the overall views jumped up like a Laffer Curve looking for the proper tax rate of 58 percent on upper incomes. I'm getting direct page hits for "RIP Republican Party" boom and boom. For an article that's almost a year old, this is getting up there with my classic Woodstock Port-O-San Guy article (P.S. Mr. Taggart PLEASE email me!).
Funny thing is, I wasn't advertising it, pushing it on Twitter or Facebook or anything. Just, of its own accord, people have been searching for articles about the death of the Republican Party, and my article has been getting the search results.
This traffic uptick started this past Wednesday, on the third night of the DNC speeches, when Biden and Panetta and Kaine and Bloomberg and OBAMA all came out and nuked Trump from orbit.
The other bloggers I follow - Rude Pundit and Driftglass and Balloon Juice in particular - are all pointing out how the Democrats presented a positive patriotic platform that the Republicans woefully failed to do last week. The differences are stark, and even the conservative punditry is freaking out over it.
It shouldn't be surprising that right about now, people are wondering just what the hell is wrong with the Republican Party as it has (and continues to) fallen apart.
So, thank you readers. Thank you for visiting this humble site.
Now if I can get the traffic to pick up on my political rants book I'm shilling over here on the right column of this blog! --------->
C'mon folks, let's see if we can get this baby on the Amazon.com Non-Fiction Bestsellers list!

Showing posts with label numbers. Show all posts
Showing posts with label numbers. Show all posts
Friday, July 29, 2016
Thursday, March 24, 2016
The Trick Is Never Be More Hated Than Your Opponent
There's some more numbers to crunch, a lot of it tied into the popularity numbers of the two lead candidates this 2016 for the Presidency.
Here's a poll for how the three major voting factions - Republican, Democrat, Independent - would (un)favor either Trump or Hillary (poll by Quinnipiac University, linked to Washington Post):

Additional polling shows - and it's hidden in the numbers - how Trump is getting about 49 percent of the White Male vote. For any Republican to be under50 55 60 percent White support of any kind in this day and age is woeful for the GOP.
But let's look at that chart. It asks "Which of these candidates would you never vote for?"
Overall, 42 percent say they'll never vote for Hillary and 58 percent will never vote for Trump.
Break it down by party, and you'll get the standard partisan response: there's no way Democrats will vote for Trump (he's over 84-86 percent on that chart) and there's no way Republicans will vote for Hillary (sitting at 80 percent denial).
But the number for them within their own ranks is what will be troubling for Republicans. Hillary has 6 percent haterdom among Democrats (which looks shockingly low given all the Bernie supporters bash her) but Trump is nearly triple that with 17 percent Republicans refusing to vote for him.
Granted, by the time the actual election kicks in, some of those haters will settle down and return to their party folds. Thing is. Hillary will find it easier to do that and Trump won't: if they get half back to their parties, Hillary can lose 3 percent of her base to Trump losing around 9 percent.
Those are the voters most likely to not even show up at all: the partisan nature of being in a party means they won't cross the aisle to vote for the opponent, but they'll be unhappy enough to sit out altogether.
Can the Republicans afford to have around 8 to 10 percent of their party to avoid the general election? No, going by how things went in 2012 they can't, because they lost then and if they have lower turnout in 2016 they'll lose to an even worse percentage.
And when you throw in how in 2012 Mitt Romney won the Independent voter turnout 50 to 45 percent (the missing 5 percent went third-party) AND STILL LOST to Obama, Trump can't afford to be down among Independents 46-to-54.
Still, the troubling factor here for Republicans is the likelihood that the voters who hate Trump that much may not show up for the election at all. While there's little solid evidence of "coat-tails" of a Presidential candidate helping the down-ticket candidates, there is evidence that lower turnout overall by one party is bad news for that party's lesser candidates from the Congressional districts down to state and county offices.
Even with Congressional seats gerrymandered up the wazoo (about 55 percent of Republican seats are compared to 25 percent for Democrats), any downturn in turnout can run the risk of close losses (as long as Democrats run challengers in all of those districts) for those Republicans. The Senate races may not be directly affected by voters discouraged by Trump, but there will be an impact in close-race states like Florida and Kentucky.
It's interesting to note how - despite all the media chatter and despite all the drum-beating by Bernie's supporters - the hatedom for Hillary is not that severe compared for Trump. It's really not as bad as most of the other Democratic front-runners have endured from their own ranks before. Only six percent of Democrats refuse to vote for her? Wow, the party's really warmed up to Hillary...
Here's a poll for how the three major voting factions - Republican, Democrat, Independent - would (un)favor either Trump or Hillary (poll by Quinnipiac University, linked to Washington Post):
Additional polling shows - and it's hidden in the numbers - how Trump is getting about 49 percent of the White Male vote. For any Republican to be under
But let's look at that chart. It asks "Which of these candidates would you never vote for?"
Overall, 42 percent say they'll never vote for Hillary and 58 percent will never vote for Trump.
Break it down by party, and you'll get the standard partisan response: there's no way Democrats will vote for Trump (he's over 84-86 percent on that chart) and there's no way Republicans will vote for Hillary (sitting at 80 percent denial).
But the number for them within their own ranks is what will be troubling for Republicans. Hillary has 6 percent haterdom among Democrats (which looks shockingly low given all the Bernie supporters bash her) but Trump is nearly triple that with 17 percent Republicans refusing to vote for him.
Granted, by the time the actual election kicks in, some of those haters will settle down and return to their party folds. Thing is. Hillary will find it easier to do that and Trump won't: if they get half back to their parties, Hillary can lose 3 percent of her base to Trump losing around 9 percent.
Those are the voters most likely to not even show up at all: the partisan nature of being in a party means they won't cross the aisle to vote for the opponent, but they'll be unhappy enough to sit out altogether.
Can the Republicans afford to have around 8 to 10 percent of their party to avoid the general election? No, going by how things went in 2012 they can't, because they lost then and if they have lower turnout in 2016 they'll lose to an even worse percentage.
And when you throw in how in 2012 Mitt Romney won the Independent voter turnout 50 to 45 percent (the missing 5 percent went third-party) AND STILL LOST to Obama, Trump can't afford to be down among Independents 46-to-54.
Still, the troubling factor here for Republicans is the likelihood that the voters who hate Trump that much may not show up for the election at all. While there's little solid evidence of "coat-tails" of a Presidential candidate helping the down-ticket candidates, there is evidence that lower turnout overall by one party is bad news for that party's lesser candidates from the Congressional districts down to state and county offices.
Even with Congressional seats gerrymandered up the wazoo (about 55 percent of Republican seats are compared to 25 percent for Democrats), any downturn in turnout can run the risk of close losses (as long as Democrats run challengers in all of those districts) for those Republicans. The Senate races may not be directly affected by voters discouraged by Trump, but there will be an impact in close-race states like Florida and Kentucky.
It's interesting to note how - despite all the media chatter and despite all the drum-beating by Bernie's supporters - the hatedom for Hillary is not that severe compared for Trump. It's really not as bad as most of the other Democratic front-runners have endured from their own ranks before. Only six percent of Democrats refuse to vote for her? Wow, the party's really warmed up to Hillary...
Tuesday, March 22, 2016
The Three Key Numbers To Track This 2016 Election
As with any prolonged, complex campaign like a Presidential election, there are tons of raw numbers to comb through in order to make sense of the data and try to guess at predicted results.

Considering how important it is to ensure our nation's safety, it's vital to track Trump's numbers in the polls and pray to the Old Gods and the New that such numbers track bad for him and great for us (and by "us" I mean 6.5 billion people on the planet Earth).
I follow Jamelle Bouie on Twitter and he brought up an interesting reminder from January about Trump's unfavorable numbers: If I can find an image link I'll post it here, hold on...
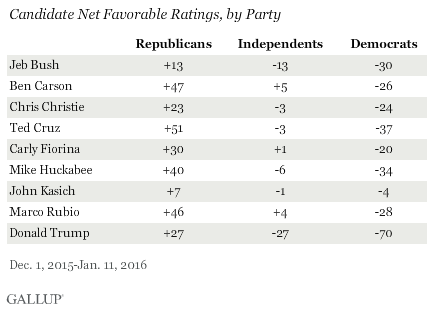
For the primary season, the only column that matters for Trump is the Republican one: as long as he stays on the plus side, he's winning (and has been). It's that middle column that catches my attention: Independents are going to matter a lot when the cycle shifts over to the General election. With a lot of primaries and caucuses Closed to party-only voters, their opinions didn't matter: but in the General they do get to choose between Republican or Democrat (or Third Party, eh) and that's when their vote matters. And that's when that minus-27 points comes up to bite Trump and the Republicans on the ass.
Only thing about that chart: it's last update was January 11th. There's been a lot of changes since then (lots of drop-outs) and it'd be nice to see what the current numbers will say.
There's a lot of other numbers to track as well when it comes time for the primaries to end and the general vote to begin. A lot of key vectors that will show how the eventual nominees - currently Trump and Hillary - will perform and where they may need to adjust tactics to improve their results. One thing to follow is going to be Trump's changing his anti-immigrant Mexican-hating tune when the numbers start telling his campaign managers how deep in the red that's dropping his numbers.
But while it'll be noteworthy to see how the Hispanic voting bloc warms to Trump - hint, they're not - the actual impact of that number can be deflected by other factors such as actual voter turnouts. So until turnout numbers can be confirmed or safely guessed at, that's just a notable side to track.
I'm going to narrow it down to just three numbers we'll need to track as a nation to see how we'll survive the oncoming storm that is Hurricane Trump 2016:
Party Enthusiasm: Which party is going to keep their voter base happy and eager to get the vote out? This New York Times article does some polling on that issue, and currently finds that the Democrats are more content with their party's overall position. A majority (around 60 percent) of Republicans are upset about how messy and divisive their primaries have been, and while Trump's support has gone up to 46 to 49 percent Republicans backing him, there's still a lot of discontent keeping him from a majority in his own party's ranks.
One of the narratives out there is how Republicans are fearing a drop in turnout. Granted, that report is coming from Karl "Which Reality Am I In Again" Rove, but Trump's low support - he's the front-runner but only 49 percent - and nearly half of Republicans polled are openly answering that they might not support him in the general. While Rude Pundit would remind me and others that when it comes down to it, the party voters will vote the party line even when common sense tells them the party's gonna screw them, Trump may be the one real exception because few candidates have garnered such disgust/disagreement/dismay from nearly half his/her own party... speaking of, the next number to track.
Independent Voter Favorability of Candidates: Like noted earlier from Bouie, that Gallup polling on the plus-minus favorability of candidates is going to be key. As long as Trump's negatives are higher than Hillary's negatives (and yes, she's up there), Trump's not going to win this thing.
This argument is purely anecdotal and based on my belief that Machiavelli wasn't joking or exaggerating about the argument over whether it is better to be loved or feared. To Machiavelli, it's hard to be both to where Princes (political leaders) should aim more for Feared (Loved makes them too vulnerable). But Machiavelli warns the trick is to avoid being Hated: the second people hate you, you lose their support and you gain more enemies. Hatred invites mockery and scorn: and rarely can you win any of them back - barring a sincere change of behavior and atonement in the leader - meaning they're lost for good.
We've seen this before, whenever a popular politician goes from being liked to despised: I can throw out a list of names from Harry Truman (whose popularity tanked in the 1950s) to Richard Nixon (oh brother) to Sarah Palin (a large media fanbase who quickly soured on her and turned her into a target of parody) to let's admit it Barack Obama (based not on reality but on a major GOP campaign of misinformation).
Thing is, once Trump's unfavorables are at a particular point - especially after the convention and the general election gears up in earnest - there's very little he can do to turn that around. He can bullsh-t all he wants, but one of the big reasons he HAS those high unfavorables is that his haters KNOW he's a bullsh-tter and isn't going to buy one word of it.
The final number to keep track of is Barack Obama's Favorability: this is a key number for Democrats because as long as Obama polls favorable, that means a significant portion of the voter base are content with the current economic trends, and will vote to protect his legacy and ensure the next President continues Obama's policies.
Right now (March 22) Obama is polling pretty well, close to 50 percent and almost entirely in the plus+ favorables. Historically, a lot of Presidents in their final years see a downturn in such numbers: Truman is a perfect example, but also Eisenhower dropped, Reagan dropped, Clinton dropped, Dubya dropped. Bush the Lesser's dropping into the low 30s was a key factor in the Republicans losing in 2008. For Obama to be well into the high 40s if not 50 percent itself is a great sign, because that covers not only the Democratic base being content but a significant portion of the Independent voters as well.
So, who else is going to track them numbers with me?
Update (3/23/16): RealClearPolitics has updated some of the polling on the hypothetical matchup Trump vs. Clinton. Caveat as always: it's early in the year and these numbers can change due to external factors and voter mood swings. I think I can copy/paste the table here:
For the main candidate of the Republican Party to be polling in late March below 40 percent on average is not a good sign for the GOP. The real troubling number for Republicans is how Trump's unpopularity (-28) runs deeper than Hillary's (-17)... because in that situation the voters in the middle will vote for the candidate they can tolerate or at least not hate as much.
Update (3/23/16): RealClearPolitics has updated some of the polling on the hypothetical matchup Trump vs. Clinton. Caveat as always: it's early in the year and these numbers can change due to external factors and voter mood swings. I think I can copy/paste the table here:
Polling Data
| Poll | Date | Sample | MoE | Clinton (D) | Trump (R) | Spread |
|---|---|---|---|---|---|---|
| RCP Average | 2/29 - 3/22 | -- | -- | 49.3 | 38.8 | Clinton +10.5 |
| FOX News | 3/20 - 3/22 | 1016 RV | 3.0 | 49 | 38 | Clinton +11 |
| Bloomberg | 3/19 - 3/22 | 815 LV | 3.4 | 54 | 36 | Clinton +18 |
| Quinnipiac | 3/16 - 3/21 | 1451 RV | 2.6 | 46 | 40 | Clinton +6 |
| CBS News/NY Times | 3/17 - 3/20 | 1058 RV | 4.0 | 50 | 40 | Clinton +10 |
| CNN/ORC | 3/17 - 3/20 | 925 RV | 3.0 | 53 | 41 | Clinton +12 |
| ABC News/Wash Post | 3/3 - 3/6 | 864 RV | 4.0 | 50 | 41 | Clinton +9 |
| NBC News/Wall St. Jrnl | 3/3 - 3/6 | 1200 RV | 2.8 | 51 | 38 | Clinton +13 |
| Rasmussen Reports | 2/29 - 3/1 | 1000 LV | 3.0 | 41 | 36 | Clinton +5 |
For the main candidate of the Republican Party to be polling in late March below 40 percent on average is not a good sign for the GOP. The real troubling number for Republicans is how Trump's unpopularity (-28) runs deeper than Hillary's (-17)... because in that situation the voters in the middle will vote for the candidate they can tolerate or at least not hate as much.
Saturday, March 19, 2016
Playing With the Demographics On The Electoral College Map: March 2016 Edition (Updated)
You probably notice I like messing with interactive maps.
There's a fun one on 270towin.com where you can predict which state goes Red or Blue for 2016, and can see which states the polling experts still view as toss-ups.
Well, Jamelle Bouie from Slate has been tweeting a bit about Trump's lack of popularity among the demographics of the projected 2016 voters, and he's pointing to another map generator, this time created on RealClearPolitics that goes by the actual voter turnout nationwide from 2012, and how those votes configured into the Electoral wins by state.

Some trends you need to consider for the election going into 2016:
So how would things look for Republican voters vs. Democratic voters in the general election for the Presidency?
If Trump's current polling numbers are correct then he's getting about 49 percent of the White voting bloc (to Hillary's projected 40 percent).
Remember, Mitt Romney got about 59-60 percent of Whites in 2012... and still lost.
If we apply that to the RCP map generator, we should get this:

The map also adjusts the projected turnout by state, and that's if voter turnout remains the same (sans any voter suppression of non-Whites).
Dear God, look at those numbers.
The Democrats will absolutely crush it with the Popular vote getting 60 percent of the turnout at 79.4 million voters. Hillary will get 40 states plus DC to Trump getting 10. Hillary will win states that Democrats haven't naturally won in decades: Mississippi, South Carolina, Nebraska, Arizona and Georgia and Missouri and Kentucky and Tennessee will go Blue. TEXAS for the Love of God, Trump can lose Texas to the Dems.
And that's if voter turnout by the non-Whites stay the same. Given the insults Trump is throwing at Mexicans and Asians, I doubt the Republicans will see any love by those blocs.
Let's say the Republicans drop among Hispanics to 20 percent support - and this is being generous, there's every likelihood the Hispanic vote could drop to single digits like Blacks have done - and 25 percent support for Asians. The map is going to look like this with the same voter turnout as 2012:

Popular vote turnout for Dems go up to 81 million. Trump LOSES ALASKA in this. I'm surprised Kansas lasted this long before flipping.
This is a legitimate interpretation of that Washington Post poll, which shows Hillary and the Dems getting 79 percent of the minority voting blocs (mixing in Blacks, Hispanics and Asians together). So this could be a genuine result this November.
This is why the Republican Establishment is committing public ritual suicide as we speak.
This is why not only are the Republican party leaders planning and praying for a Third Party intervention (which really won't work the way they hope), this is why there's going to be some very nasty voter suppression efforts where the Republicans can pull it off. And why the civil rights groups defending voters need a ton of support to stop those suppression efforts.
Because if the Republicans do force the turnout by minorities down, with the voter turnout the way the polling suggests now. Say for example the voter suppression efforts knock Black turnout down from 66 percent to 60, and Hispanic turnout to 40 percent and Asians to 45 percent...

Wow. They're still losing Texas. Republicans do get back South Carolina and Mississippi, but without Texas' massive Electoral count the GOP is still screwed.
So that voter suppression has to really kick in - let's say forcing voter turnout among all Non-Whites down to 10 percent for each group, and knocking a few percents off for Whites who could be college-age and blocked by the lack of ID - for the Republicans to see any advantage:

Actually, wait, that won't work either. Hillary still wins the Popular vote by 49 million to Trump's 43 million... and wins the Electoral College with 352 Electors. It is entirely possible the percentage of voter turnout by state may not actually reflect this via suppression efforts: however, given that there's no legal way the Republicans will suppress minority voter turnout to THAT degree we shouldn't expect the result to be this GOOD for Republicans. Which, of course, it isn't.
Wow. Republicans really are screwed this Presidential cycle.
The only thing that could throw this whole thing to the Republicans now would be the anti-Hillary voters among the Bernie supporters in the Democratic primaries. The ones who are opining that they'd rather stay home than vote for Hillary (or worse, vote for Trump).
This is now the time for sane and responsible persons reading this blog to calmly sit down with Bernie supporters and remind them that FOR THE LOVE OF F-CKING GOD GET THE GODDAMN VOTE OUT FOR THE DEMOCRATIC PARTY THIS NOVEMBER. Thank you.
Update: After a night of thinking about it, I realized I need to see how the demographic generator could project what level of turnout the Republicans DID need in order to win enough states for the Electoral counts. So I went back in and messed with the numbers some more.
I decided to keep the Republican White Non-Hispanic numbers close to where Romney had it in 2012 (around 60 percent). Even though Trump is showing signs he'll never reach that level, let's just give them to them as their best-case scenario.
I dropped the voter turnout for the Non-Whites (Blacks, Hispanics, Asians) to reflect the voter suppression efforts that are bound to work. I didn't go as severe as 10 percent across the board, because even THAT would be too obvious a rigged election, and unlikely to happen. There still has to be an aggressive amount of blocked voters for this math to work...
I did go with keeping Black support for Republicans at 6 percent, and I did drop Hispanic to 20 percent for Republicans because Trump's anti-immigrant platform has made the party toxic to that group (I'm still being generous: there's every likelihood Hispanic support will drop to single digits). I dropped Asians to 29 percent as part of the response to the GOP's anti-immigrant hostility (of course the percentage can easily drop like Blacks and Hispanics into single digits).
With all that set, I started adjusting the one thing that could boost a Republican win: overall White voter turnout. Currently at 66 percent, I wanted to see how high it had to go for the Republicans to see a win.

I got to 83 percent before the Electoral count shifts from Democrat to Republican.
And that's with me being generous on the minority voting blocs not going into full Rejection mode against the GOP (and noting that voter suppression won't deny every minority voter who shows).
There's one little problem with this, and the Republican leadership likely knows it: the current public mood against politics - thanks to decades of mudslinging and partisanship - has killed off interest from potential voters to register and turn out. Getting White voter turnout to swing UPWARD against a demographic shift that has them going down down down defies not only the laws of logic but the laws of physics (gravity is a harsh mistress). There is no sane way Republicans can get White voter turnout to jump up from 66 to 83 percent.
Outside of massive nationwide vote rigging (likely, but risky due to any one miscue blowing it all up), there does not look to be any sane way the Republicans are going to win in 2016 despite all their hopes. And Trump is dumping on those hopes with one big heaping pile of dung that can't get shoveled away.
Which is probably why the Republican elites are clinging to the insane ways, as though a three-party run can split enough Electoral states to throw the results into a Republican-controlled House.
Just to be on the safe side, America; get the damn vote out for ALL the demographics, and for the Love of GOD vote Democrat.
There's a fun one on 270towin.com where you can predict which state goes Red or Blue for 2016, and can see which states the polling experts still view as toss-ups.
Well, Jamelle Bouie from Slate has been tweeting a bit about Trump's lack of popularity among the demographics of the projected 2016 voters, and he's pointing to another map generator, this time created on RealClearPolitics that goes by the actual voter turnout nationwide from 2012, and how those votes configured into the Electoral wins by state.

This generator seems to go by how the ethnic votes were split between the major parties, with the Republican percentages up for adjustment with the Democratic percentages auto-correcting (this might not reflect the real-world percent sharing).
So this map allows you to alter two things: the shared percentage by ethnic voting bloc, and also by actual voter turnout by that bloc: over 66 percent of Whites, 64 percent of Blacks, 48 percent for Hispanics and 49 percent Asians.
Some trends you need to consider for the election going into 2016:
- Voter turnout for Whites is projected to drop due to simple demographic fact of dying and aging voters from that bloc.
- Hispanic voter enrollment is expected to go up, not just because of the demographic shift but due to political activism in response to Trump's anti-Mexican anti-Immigrant rants.
- Voter turnout by minorities and college-age youth - which favors the Democrats - may take a hit from anti-voter suppression efforts in roughly 22 states - which, guess what, are run by Republicans - that can see a minor yet significant drop to those demographics.
So how would things look for Republican voters vs. Democratic voters in the general election for the Presidency?
If Trump's current polling numbers are correct then he's getting about 49 percent of the White voting bloc (to Hillary's projected 40 percent).
Remember, Mitt Romney got about 59-60 percent of Whites in 2012... and still lost.
If we apply that to the RCP map generator, we should get this:

The map also adjusts the projected turnout by state, and that's if voter turnout remains the same (sans any voter suppression of non-Whites).
Dear God, look at those numbers.
The Democrats will absolutely crush it with the Popular vote getting 60 percent of the turnout at 79.4 million voters. Hillary will get 40 states plus DC to Trump getting 10. Hillary will win states that Democrats haven't naturally won in decades: Mississippi, South Carolina, Nebraska, Arizona and Georgia and Missouri and Kentucky and Tennessee will go Blue. TEXAS for the Love of God, Trump can lose Texas to the Dems.
And that's if voter turnout by the non-Whites stay the same. Given the insults Trump is throwing at Mexicans and Asians, I doubt the Republicans will see any love by those blocs.
Let's say the Republicans drop among Hispanics to 20 percent support - and this is being generous, there's every likelihood the Hispanic vote could drop to single digits like Blacks have done - and 25 percent support for Asians. The map is going to look like this with the same voter turnout as 2012:

Popular vote turnout for Dems go up to 81 million. Trump LOSES ALASKA in this. I'm surprised Kansas lasted this long before flipping.
This is a legitimate interpretation of that Washington Post poll, which shows Hillary and the Dems getting 79 percent of the minority voting blocs (mixing in Blacks, Hispanics and Asians together). So this could be a genuine result this November.
This is why the Republican Establishment is committing public ritual suicide as we speak.
This is why not only are the Republican party leaders planning and praying for a Third Party intervention (which really won't work the way they hope), this is why there's going to be some very nasty voter suppression efforts where the Republicans can pull it off. And why the civil rights groups defending voters need a ton of support to stop those suppression efforts.
Because if the Republicans do force the turnout by minorities down, with the voter turnout the way the polling suggests now. Say for example the voter suppression efforts knock Black turnout down from 66 percent to 60, and Hispanic turnout to 40 percent and Asians to 45 percent...

Wow. They're still losing Texas. Republicans do get back South Carolina and Mississippi, but without Texas' massive Electoral count the GOP is still screwed.
So that voter suppression has to really kick in - let's say forcing voter turnout among all Non-Whites down to 10 percent for each group, and knocking a few percents off for Whites who could be college-age and blocked by the lack of ID - for the Republicans to see any advantage:

Actually, wait, that won't work either. Hillary still wins the Popular vote by 49 million to Trump's 43 million... and wins the Electoral College with 352 Electors. It is entirely possible the percentage of voter turnout by state may not actually reflect this via suppression efforts: however, given that there's no legal way the Republicans will suppress minority voter turnout to THAT degree we shouldn't expect the result to be this GOOD for Republicans. Which, of course, it isn't.
Wow. Republicans really are screwed this Presidential cycle.
The only thing that could throw this whole thing to the Republicans now would be the anti-Hillary voters among the Bernie supporters in the Democratic primaries. The ones who are opining that they'd rather stay home than vote for Hillary (or worse, vote for Trump).
This is now the time for sane and responsible persons reading this blog to calmly sit down with Bernie supporters and remind them that FOR THE LOVE OF F-CKING GOD GET THE GODDAMN VOTE OUT FOR THE DEMOCRATIC PARTY THIS NOVEMBER. Thank you.
Update: After a night of thinking about it, I realized I need to see how the demographic generator could project what level of turnout the Republicans DID need in order to win enough states for the Electoral counts. So I went back in and messed with the numbers some more.
I decided to keep the Republican White Non-Hispanic numbers close to where Romney had it in 2012 (around 60 percent). Even though Trump is showing signs he'll never reach that level, let's just give them to them as their best-case scenario.
I dropped the voter turnout for the Non-Whites (Blacks, Hispanics, Asians) to reflect the voter suppression efforts that are bound to work. I didn't go as severe as 10 percent across the board, because even THAT would be too obvious a rigged election, and unlikely to happen. There still has to be an aggressive amount of blocked voters for this math to work...
I did go with keeping Black support for Republicans at 6 percent, and I did drop Hispanic to 20 percent for Republicans because Trump's anti-immigrant platform has made the party toxic to that group (I'm still being generous: there's every likelihood Hispanic support will drop to single digits). I dropped Asians to 29 percent as part of the response to the GOP's anti-immigrant hostility (of course the percentage can easily drop like Blacks and Hispanics into single digits).
With all that set, I started adjusting the one thing that could boost a Republican win: overall White voter turnout. Currently at 66 percent, I wanted to see how high it had to go for the Republicans to see a win.

I got to 83 percent before the Electoral count shifts from Democrat to Republican.
And that's with me being generous on the minority voting blocs not going into full Rejection mode against the GOP (and noting that voter suppression won't deny every minority voter who shows).
There's one little problem with this, and the Republican leadership likely knows it: the current public mood against politics - thanks to decades of mudslinging and partisanship - has killed off interest from potential voters to register and turn out. Getting White voter turnout to swing UPWARD against a demographic shift that has them going down down down defies not only the laws of logic but the laws of physics (gravity is a harsh mistress). There is no sane way Republicans can get White voter turnout to jump up from 66 to 83 percent.
Outside of massive nationwide vote rigging (likely, but risky due to any one miscue blowing it all up), there does not look to be any sane way the Republicans are going to win in 2016 despite all their hopes. And Trump is dumping on those hopes with one big heaping pile of dung that can't get shoveled away.
Which is probably why the Republican elites are clinging to the insane ways, as though a three-party run can split enough Electoral states to throw the results into a Republican-controlled House.
Just to be on the safe side, America; get the damn vote out for ALL the demographics, and for the Love of GOD vote Democrat.
Saturday, January 02, 2016
Thoughts on Numbers and Maps 2016 Edition
(Update: Hello again and Happy New Year to the Crooks & Liars readers. Thanks again to Mike's Blog Round-Up and to BlueGal in particular for linking this article there. Please take some time to visit the rest of the blog, especially the current stuff tracking the crazy situation in Oregon. If anyone can tell me where the "Please Send Snacks" Gadsden flag came from, please let me know via Twitter @PaulWartenberg or here in comments. Danke.)
I'm just gonna start throwing numbers out here for the 2016 election:
Census numbers as of 2014 (click on the XLS file links to open spreadsheets) tells us there's about 142 million registered voters. Out of a citizenry over 18 years of age - minimum age to vote - of 219 million, that about 64 percent of the population able to vote.
It is more difficult to determine actual voter registration by party because only 28 states (and DC) allow people to register a party preference. If we go by national polling self-identification - for Gallup in July 2015 it was 46 Democrat 41 Republican - and put that as a percentage to 142 million, you get 65 million Dems and 58 million GOP.
But that's not including NPA/Third party, so we need to include that... gotta find the chart for that ah here it is... this is weird in that it says 43 percent identify as Independent while 30 percent are Democrat and 26 percent are Republican. But that normally doesn't mesh with real-world numbers: actual voter registration in Florida for example has the party identification about 38 D- 34 R - 27 N. It's possible that due to the states that DO NOT require voters to identify to a party, most registered voters would think themselves independent, but that may not reflect on their direct enrollment to either major party at the state level.
If we take the Gallup poll that includes Indy voters at face value: that would be 61 million Indy/Third party voters, 42 million Democratic voters, 37 million Republican voters. That doesn't entirely reflect actual voter turnout...
If we go by the 2012 voter turnout demographics for the Presidential election by Party, it looks like this (via that Wiki article):
That table demographic if applied to the 2012 voter turnout - 126 million give or take a Cook County gravesite - 48 million Democrats voted, 40 million Republicans voted, 36 million Indy/Third voted. THAT seems more realistic (and more shocking, that so few Indy voters at 61 million self-identified as such and only 36 million showed... tsk).
Make it a given (axiom) that the party members will vote heavily for their own party (which we see in that table) regardless of the year/candidate, it comes down to how the Independents/NPAs are going to vote. If the Democrats can keep (or even improve on) their 45-50 percentage to Republicans - close split of the non-aligned voters - they can pretty much keep their overall advantage of 38-to-32 percent total voters.
The trick then for both major parties in 2016 is to not only appeal to their base - as always - but to get enough of the Independents to swing to their side. The Republicans did get 50 percent of the Indy vote but it wasn't enough to win enough states or the popular vote overall. The Democrats just have to keep the 45 percent of Indy votes they appeased last cycle while keeping their own base appeased as well.
By that logic, the Democrats have the easier path. The Republicans have to do a better job of appealing to NPA/Indy voters... which is next-to-impossible if their party platform is an extremist one. By an October 2015 WSJ/NBC News poll, self-identified Independent voters viewed Republicans as "out-of-mainstream" on five (finance, abortion, gay marriage, immigration, climate change) of six issues (the only mainstream view being about guns). If that view remains fixed by October 2016, there's little to shift Indy voters more to the GOP to change those 2012 numbers.
If we go by map it looked like this:
This is why the Democrats are focusing on repeating 2012 turnout as best as possible: it not only guarantees the popular vote win but also the Electoral College win. As long as the states that voted for Obama still vote for Hillary/Bernie, the Democrats keep control of the White House. Link to an interactive map to make your own prediction, by the by.
If there are any numbers that should bother both major parties, it's this: that same October 2015 poll I listed earlier also charted the Unfavorable numbers for the major candidates in both primaries.
It's interesting that poll did not include Bernie Sanders' favorables as a contrast to Hillary, then again the media elites are taking it as a given Hillary will win the Democratic nomination. Still, it shows the two leading names - Clinton and Trump - at near-majority hatedoms. Apply the Machiavellian maxim of "whether it is better to be loved or feared, the real trick is to avoid being hated", those unfavorable numbers bode ill for voter turnout. People won't show if their choices are between those they hate. Republican alternatives don't fare much better as Jeb Bush and Ted Cruz are both over 30 percent unfavorables - that's a solid no-vote cutoff line IMHO - while Carson and Rubio are at least under 20 percent hater status (which does explain why the media keeps thinking Rubio's gonna happen).
So what we're going to see in the 2016 election cycle is this: massive pandering by the Republican candidates to win their voting base, and then utter failure to swing back to the Moderate/Centrist facade because they caved too far Right Wing; utter silence by the Democratic Party as they try to keep a low profile, keep their far Left Wing happy with table scraps, and play to that Moderate/Centrist location to win over enough Indy voters to secure enough states for Electoral College wins.
Expect a lot of despair and frustration over the national ticket well into March when the Primaries actually kick in.
Thank GOD there's the NFL Rookie Draft in April to keep me distracted. Tampa Bay needs a lot of help at Defensive End and Cornerback this off-season, and Free Agency moves at DE have not panned out...
I'm just gonna start throwing numbers out here for the 2016 election:
Census numbers as of 2014 (click on the XLS file links to open spreadsheets) tells us there's about 142 million registered voters. Out of a citizenry over 18 years of age - minimum age to vote - of 219 million, that about 64 percent of the population able to vote.
It is more difficult to determine actual voter registration by party because only 28 states (and DC) allow people to register a party preference. If we go by national polling self-identification - for Gallup in July 2015 it was 46 Democrat 41 Republican - and put that as a percentage to 142 million, you get 65 million Dems and 58 million GOP.
But that's not including NPA/Third party, so we need to include that... gotta find the chart for that ah here it is... this is weird in that it says 43 percent identify as Independent while 30 percent are Democrat and 26 percent are Republican. But that normally doesn't mesh with real-world numbers: actual voter registration in Florida for example has the party identification about 38 D- 34 R - 27 N. It's possible that due to the states that DO NOT require voters to identify to a party, most registered voters would think themselves independent, but that may not reflect on their direct enrollment to either major party at the state level.
If we take the Gallup poll that includes Indy voters at face value: that would be 61 million Indy/Third party voters, 42 million Democratic voters, 37 million Republican voters. That doesn't entirely reflect actual voter turnout...
If we go by the 2012 voter turnout demographics for the Presidential election by Party, it looks like this (via that Wiki article):
| Party | ||||
|---|---|---|---|---|
| Democrats | 92 | 7 | 1 | 38 |
| Republicans | 6 | 93 | 1 | 32 |
| Independents | 45 | 50 | 5 | 29 |
Make it a given (axiom) that the party members will vote heavily for their own party (which we see in that table) regardless of the year/candidate, it comes down to how the Independents/NPAs are going to vote. If the Democrats can keep (or even improve on) their 45-50 percentage to Republicans - close split of the non-aligned voters - they can pretty much keep their overall advantage of 38-to-32 percent total voters.
The trick then for both major parties in 2016 is to not only appeal to their base - as always - but to get enough of the Independents to swing to their side. The Republicans did get 50 percent of the Indy vote but it wasn't enough to win enough states or the popular vote overall. The Democrats just have to keep the 45 percent of Indy votes they appeased last cycle while keeping their own base appeased as well.
By that logic, the Democrats have the easier path. The Republicans have to do a better job of appealing to NPA/Indy voters... which is next-to-impossible if their party platform is an extremist one. By an October 2015 WSJ/NBC News poll, self-identified Independent voters viewed Republicans as "out-of-mainstream" on five (finance, abortion, gay marriage, immigration, climate change) of six issues (the only mainstream view being about guns). If that view remains fixed by October 2016, there's little to shift Indy voters more to the GOP to change those 2012 numbers.
If we go by map it looked like this:
 |
| from the 270towin.com site |
This is why the Democrats are focusing on repeating 2012 turnout as best as possible: it not only guarantees the popular vote win but also the Electoral College win. As long as the states that voted for Obama still vote for Hillary/Bernie, the Democrats keep control of the White House. Link to an interactive map to make your own prediction, by the by.
If there are any numbers that should bother both major parties, it's this: that same October 2015 poll I listed earlier also charted the Unfavorable numbers for the major candidates in both primaries.
 |
| from Wall Street Journal/NBC News Oct. 2015 polling |
So what we're going to see in the 2016 election cycle is this: massive pandering by the Republican candidates to win their voting base, and then utter failure to swing back to the Moderate/Centrist facade because they caved too far Right Wing; utter silence by the Democratic Party as they try to keep a low profile, keep their far Left Wing happy with table scraps, and play to that Moderate/Centrist location to win over enough Indy voters to secure enough states for Electoral College wins.
Expect a lot of despair and frustration over the national ticket well into March when the Primaries actually kick in.
Thank GOD there's the NFL Rookie Draft in April to keep me distracted. Tampa Bay needs a lot of help at Defensive End and Cornerback this off-season, and Free Agency moves at DE have not panned out...
Subscribe to:
Posts (Atom)